Semana 7 Herramientas de profiling en Linux
top
¿Que es?
Es una herramienta que nos permite ver todos los procesos
top

top - 14:44:02 up 37 min,  1 user,  load average: 1,43, 0,60, 0,45                                        [0/2]
Tasks: 333 total, 1 running, 332 sleep, 0 d-sleep, 0 stopped, 0 zombie
%Cpu(s):  1,3 us,  0,5 sy,  0,0 ni, 97,6 id,  0,1 wa,  0,3 hi,  0,1 si,  0,0 st
MiB Mem :  15804,9 total,  10158,8 free,   2862,0 used,   3232,8 buff/cache
MiB Swap:  12000,7 total,  12000,7 free,      0,0 used.  12943,0 avail Mem

    PID USER      PR  NI    VIRT    RES    SHR S  %CPU  %MEM     TIME+ COMMAND
  32752 cardel    20   0 7305192 523760 419208 S  14,6   3,2   2:05.99 obs
    788 root      20   0   24,3g 121680  79960 S   8,0   0,8   2:04.01 Xorg
   1380 cardel     9 -11  107716  16560  11440 S   0,7   0,1   0:05.73 pipewire
  51414 cardel    20   0 1395,6g 434212 162312 S   0,7   2,7   0:14.12 brave
    380 root     -51   0       0      0      0 S   0,3   0,0   0:08.45 irq/53-ASUF1204:00
    386 root      20   0       0      0      0 S   0,3   0,0   0:03.18 nvidia-modeset/kthread_q
    388 root      20   0       0      0      0 I   0,3   0,0   0:02.02 kworker/u64:4-events_unbound
   1274 cardel    20   0 1020596 155404  58368 S   0,3   1,0   0:02.35 protonvpn-app
   1278 cardel    20   0   96692  16916  14620 S   0,3   0,1   0:05.67 i3bar
   1289 cardel    20   0    2572   1608   1608 S   0,3   0,0   0:01.47 i3blocks
   1490 cardel    20   0  534480  10176   9792 S   0,3   0,1   0:00.94 xdg-document-po
   3679 cardel    20   0   32,8g 377708 232228 S   0,3   2,3   0:36.30 brave
   3719 cardel    20   0   32,5g 136396 109784 S   0,3   0,8   0:09.60 brave
   5065 cardel    20   0  177784  22552  11728 S   0,3   0,1   0:04.79 pipewire-pulse
  32065 cardel    20   0  586956 131112 108952 S   0,3   0,8   0:01.13 alacritty
  32764 root      20   0       0      0      0 S   0,3   0,0   0:01.49 nvidia-drm/timeline-b
ps -p 32675
    PID TTY          TIME CMD
  32675 ?        00:00:00 evinced
htop
Top pero con interfaz gŕafica
Puede usar filtros, matar procesos, modificar la vista entre otros
ps
¿Que es ps?
Es una herramienta para visualizar un proceso en especifico y es en tiempo real
 ps -p 32675
    PID TTY          TIME CMD
  32675 ?        00:00:00 evinced
valgrind
Que es
Es una tool para hacer profiling en C++ (Linux)
#include <cstdio>
#include <vector>

using namespace std;

const int n = 100000000;
vector<int> v(n);

void llenar() {
  for (int i = 0; i < n; i++) {
    v[i] = 1;
  }
}

int main() { llenar(); }
compilar:
    g++ -o exe operacion.cpp
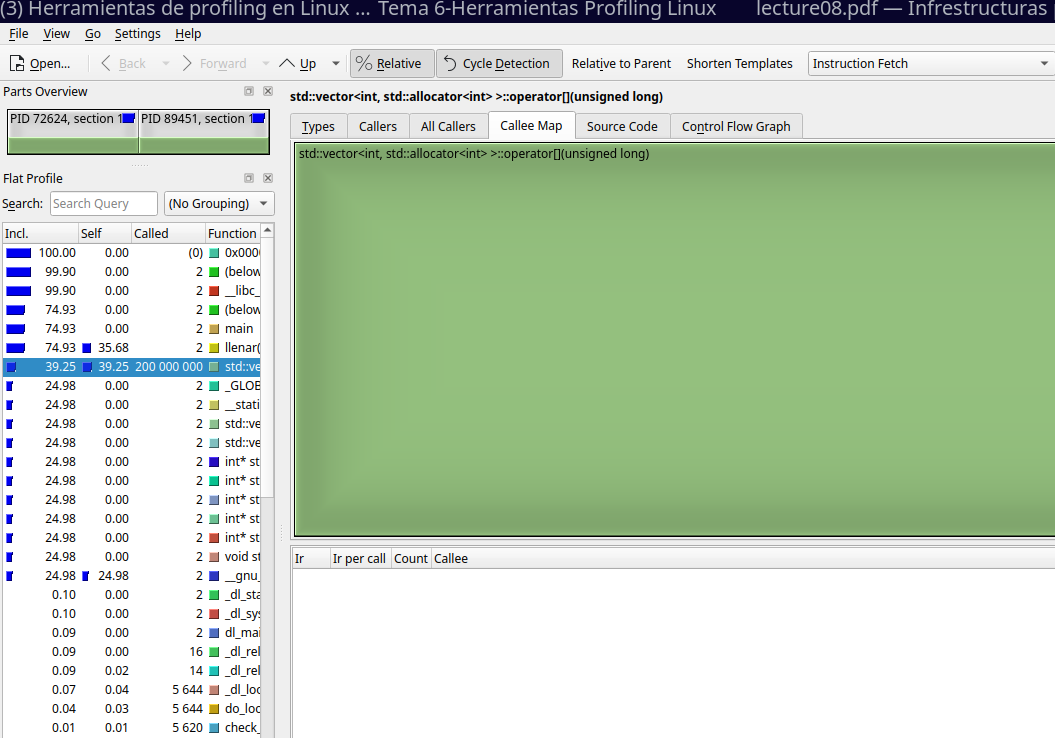
    valgrind --tool=callgrind --dump-instr=yes --simulate-cache=yes --collect-jumps=yes ./exe
    rm exe

visualizar:
    kcachegrind callgrind.out.*
Perf
¿Que es?
- Es una herramienta para profiling en Linux, permite ver las estadisticas de procesos que se están ejecutando
- Recordar que se necesitan permisos de administrador (root) si quiere ver procesos de otros usuario
perf stat -p 32752 sleep 5

 Performance counter stats for process id '32752':

            863,23 msec task-clock:u                     #    0,173 CPUs utilized
                 0      context-switches:u               #    0,000 /sec
                 0      cpu-migrations:u                 #    0,000 /sec
             5.050      page-faults:u                    #    5,850 K/sec
     1.214.167.986      instructions:u                   #    0,60  insn per cycle
                                                  #    0,59  stalled cycles per insn
     2.011.700.131      cycles:u                         #    2,330 GHz
       718.627.521      stalled-cycles-frontend:u        #   35,72% frontend cycles idle
       176.622.520      branches:u                       #  204,607 M/sec
         9.614.485      branch-misses:u                  #    5,44% of all branches

       5,002299857 seconds time elapsed
perf record -g -p 32752 sleep 5

#Generada un archivo perf.data
perf report

Samples: 3K of event 'cycles:Pu', Event count (approx.): 1938144875
  Children      Self  Command          Shared Object                    Symbol
+   30,17%     0,00%  libobs: graphic  libc.so.6                        [.] 0x000073fcd9127aac
+   30,17%     0,00%  libobs: graphic  libc.so.6                        [.] 0x000073fcd90a370a
+   23,40%     0,00%  libobs: graphic  libobs.so.30                     [.] 0x000073fcdaf80ea0
+   23,17%     0,00%  libobs: graphic  libobs.so.30                     [.] 0x000073fcdaf6aec6
+   23,09%     0,00%  libobs: graphic  linux-capture.so                 [.] 0x000073fca7ef2f4d
+   10,19%     0,00%  obs              obs                              [.] 0x00005eb74005e855
+   10,19%     0,00%  obs              libc.so.6                        [.] __libc_start_main
+   10,19%     0,00%  obs              libc.so.6                        [.] 0x000073fcd9035488
+   10,19%     0,00%  obs              obs                              [.] 0x00005eb74005c5f3
perf report --stdio

# To display the perf.data header info, please use --header/--header-only options.
#
#
# Total Lost Samples: 0
#
# Samples: 3K of event 'cycles:Pu'
# Event count (approx.): 1938144875
#
# Children      Self  Command          Shared Object                    Symbol
# ........  ........  ...............  ...............................  .............................................................................................................................................................................................................
#
    30.17%     0.00%  libobs: graphic  libc.so.6                        [.] 0x000073fcd9127aac
            |
            ---0x73fcd9127aac
               0x73fcd90a370a
               |
               |--23.40%--0x73fcdaf80ea0
               |          |
               |           --23.17%--0x73fcdaf6aec6
:
perf record -g -p 32752 sleep 5
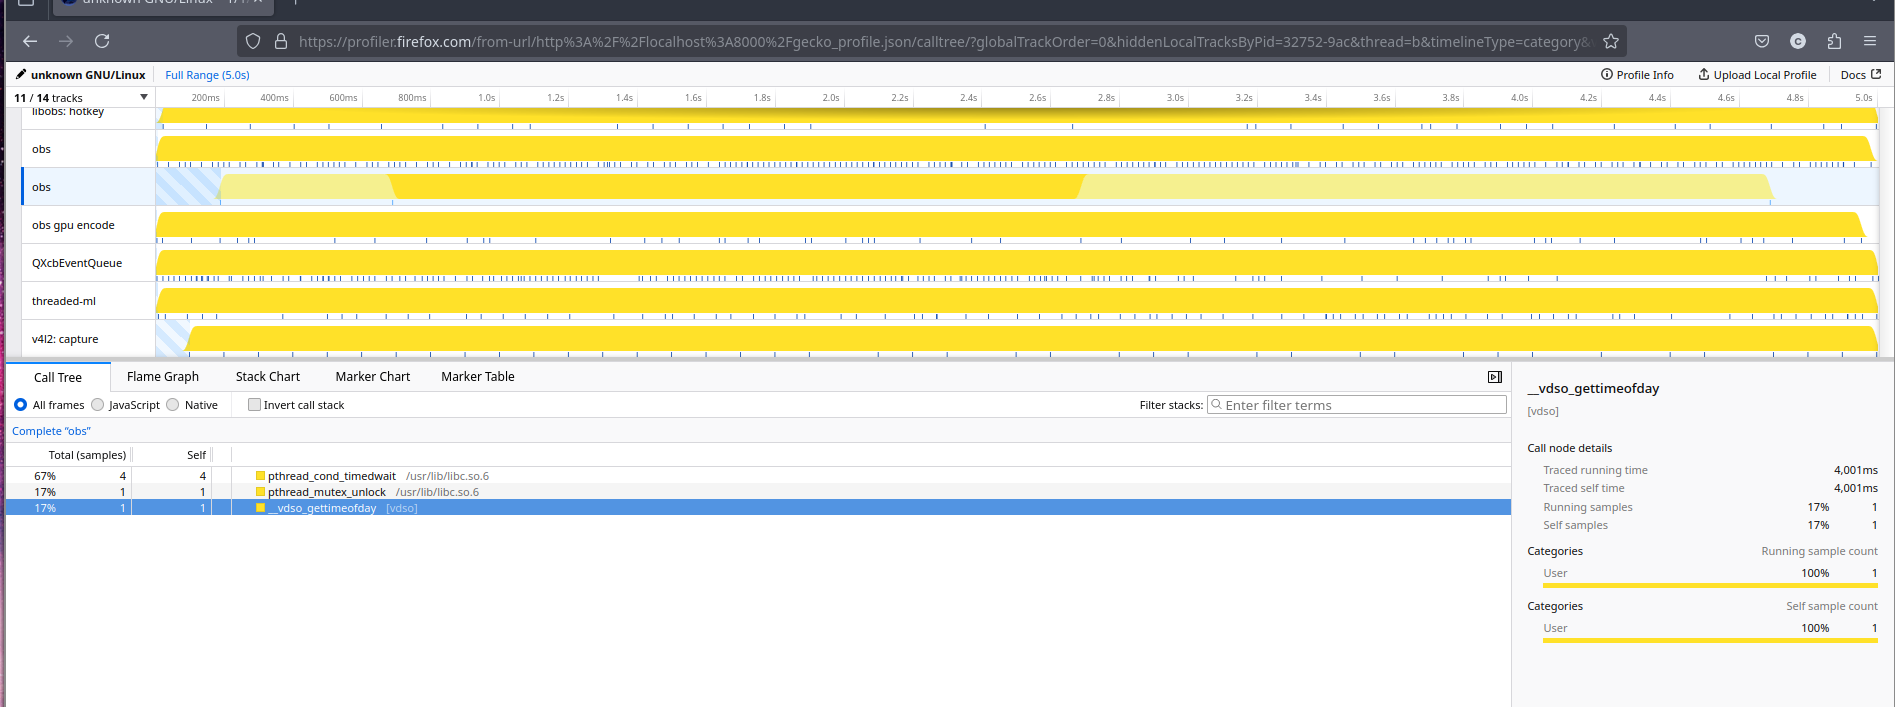
perf script report gecko